
The following charts show various data about the economic outcomes of different types of immigrant groups, as well as a comparison of permanent resident and citizen entries compared with net non-permanent resident migration by year.
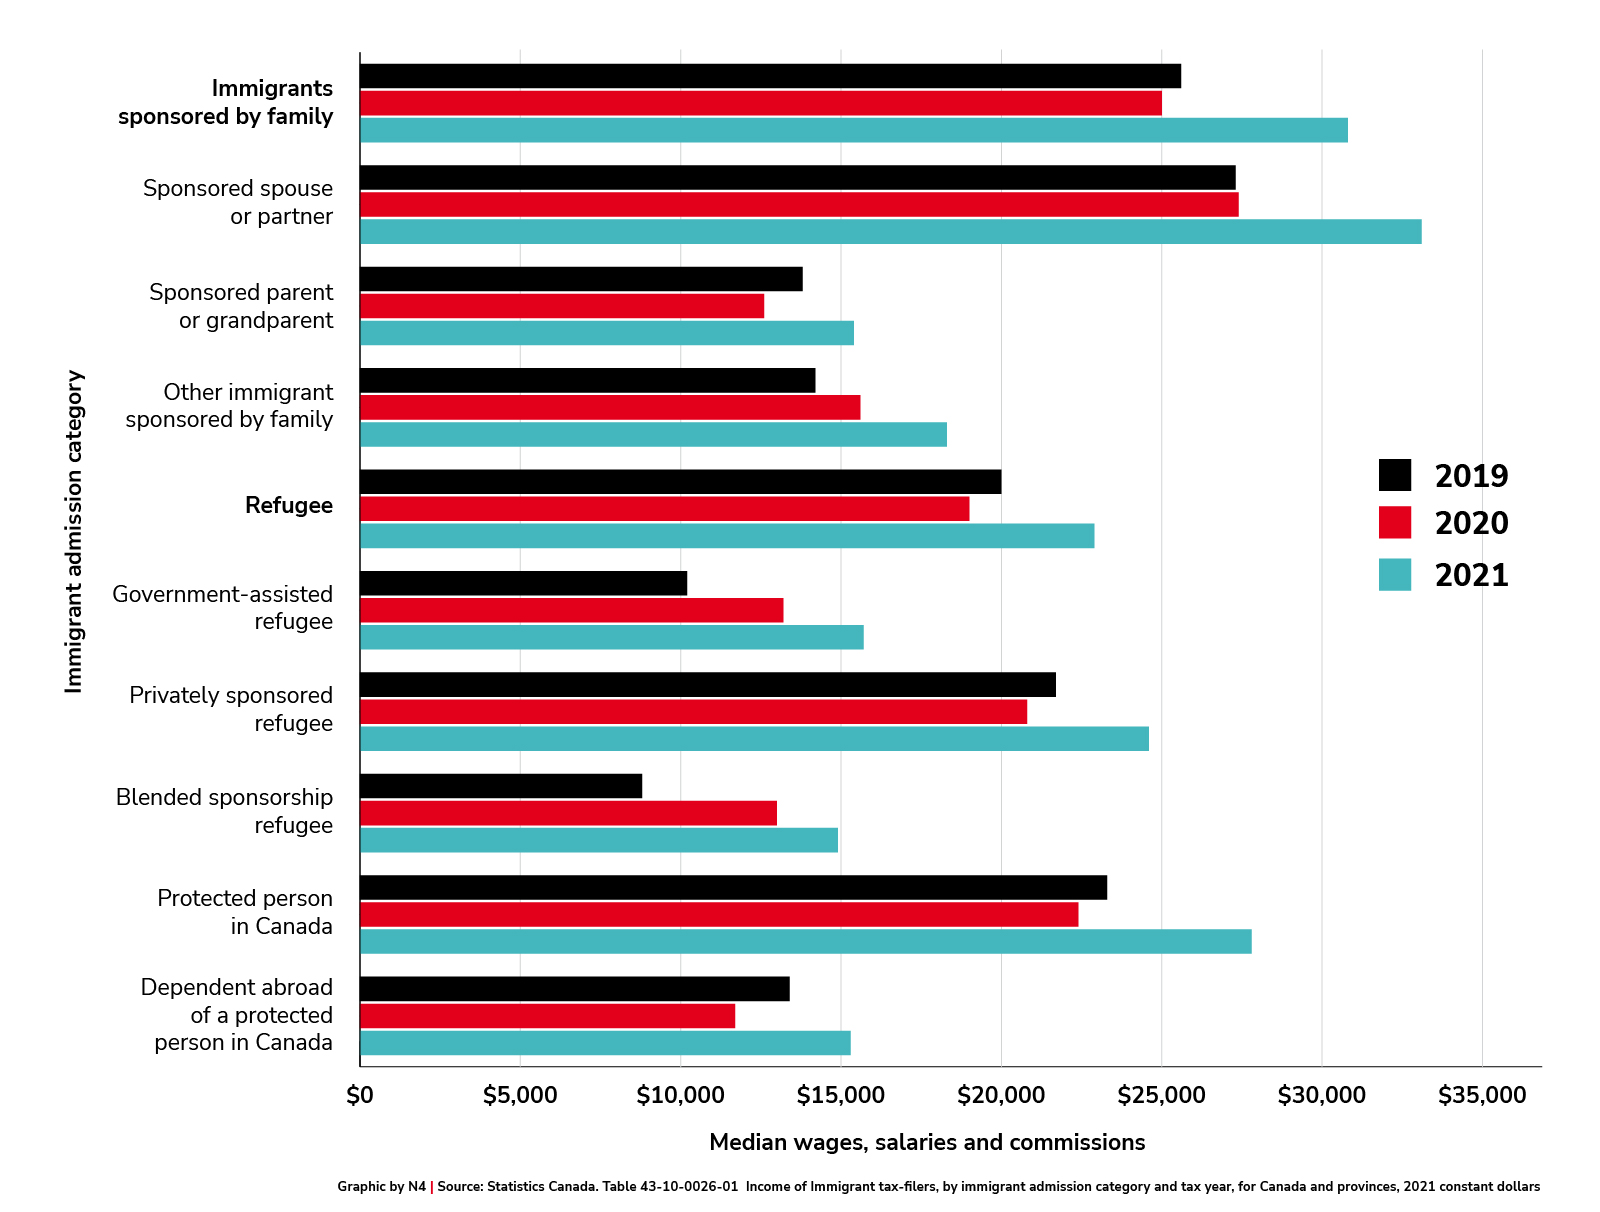
Employment and self-employment income, and social assistance rates, are all affected by admission type. Refugees earn the least income and receive the highest rates of social assistance. Principal applicants, particularly for economic class admissions, earn more than spouses and dependents. Immigrants from the Canadian experience class earn more than immigrants arriving through other channels; however, when it comes to self-employment, newcomers arriving through the business program earn more.
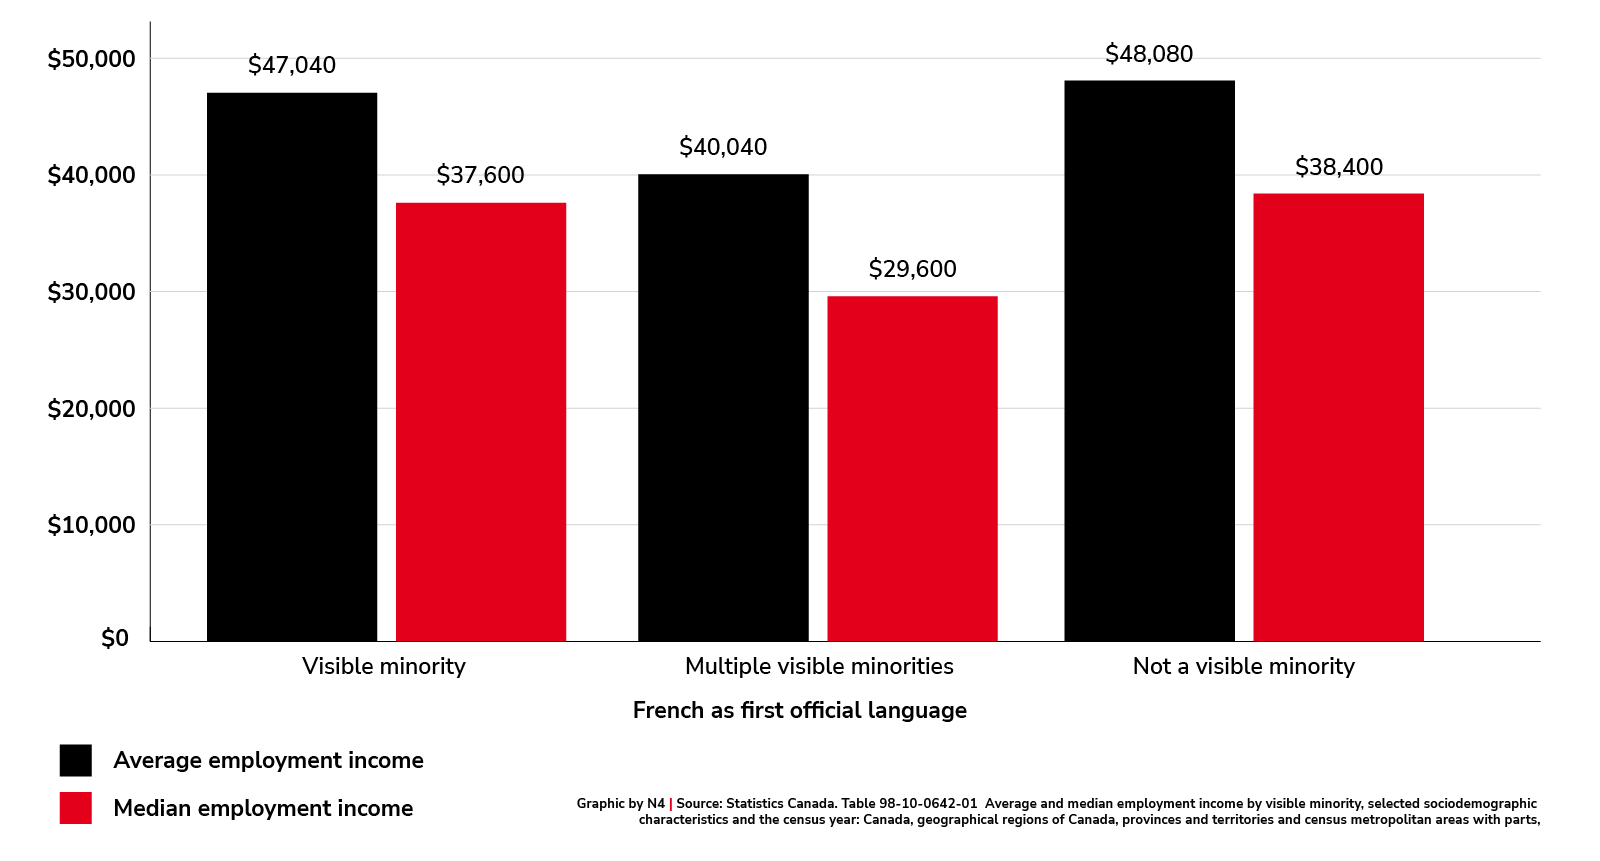
Visible minorities and French speakers have slightly lower average and mean employment income.
Median wages, salaries and commissions ($) by year (all admission categories)
Source: Statistics Canada. Table 43-10-0026-01 Income of Immigrant tax-filers, by immigrant admission category and tax year, for Canada and provinces, 2021 constant dollars, https://www150.statcan.gc.ca/t1/tbl1/en/tv.action?pid=4310002601&pickMembers%5B0%5D=1.1&pickMembers%5B1%5D=2.1&pickMembers%5B2%5D=3.1&pickMembers%5B3%5D=4.1&pickMembers%5B4%5D=5.11&pickMembers%5B5%5D=7.5&cubeTimeFrame.startYear=2019&cubeTimeFrame.endYear=2021&referencePeriods=20190101%2C20210101.
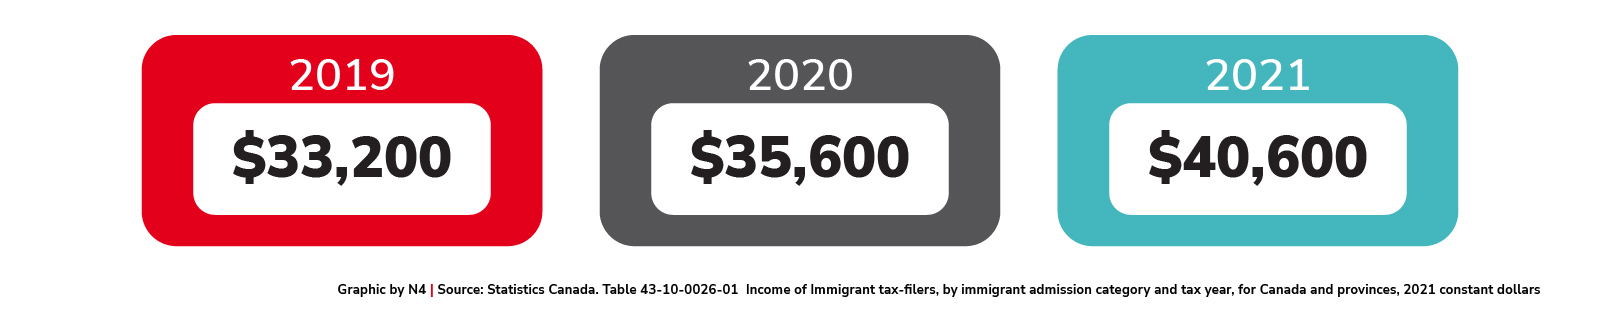
Median income of immigrants admitted in 2018
Source: Statistics Canada. Table 43-10-0026-01 Income of Immigrant tax-filers, by immigrant admission category and tax year, for Canada and provinces, 2021 constant dollars, https://www150.statcan.gc.ca/t1/tbl1/en/tv.action?pid=4310002601&pickMembers%5B0%5D=1.1&pickMembers%5B1%5D=2.1&pickMembers%5B2%5D=3.1&pickMembers%5B3%5D=4.1&pickMembers%5B4%5D=5.11&pickMembers%5B5%5D=7.5&cubeTimeFrame.startYear=2019&cubeTimeFrame.endYear=2021&referencePeriods=20190101%2C20210101.
Median income comparison of economic immigrant principal applicants vs spouses and dependents
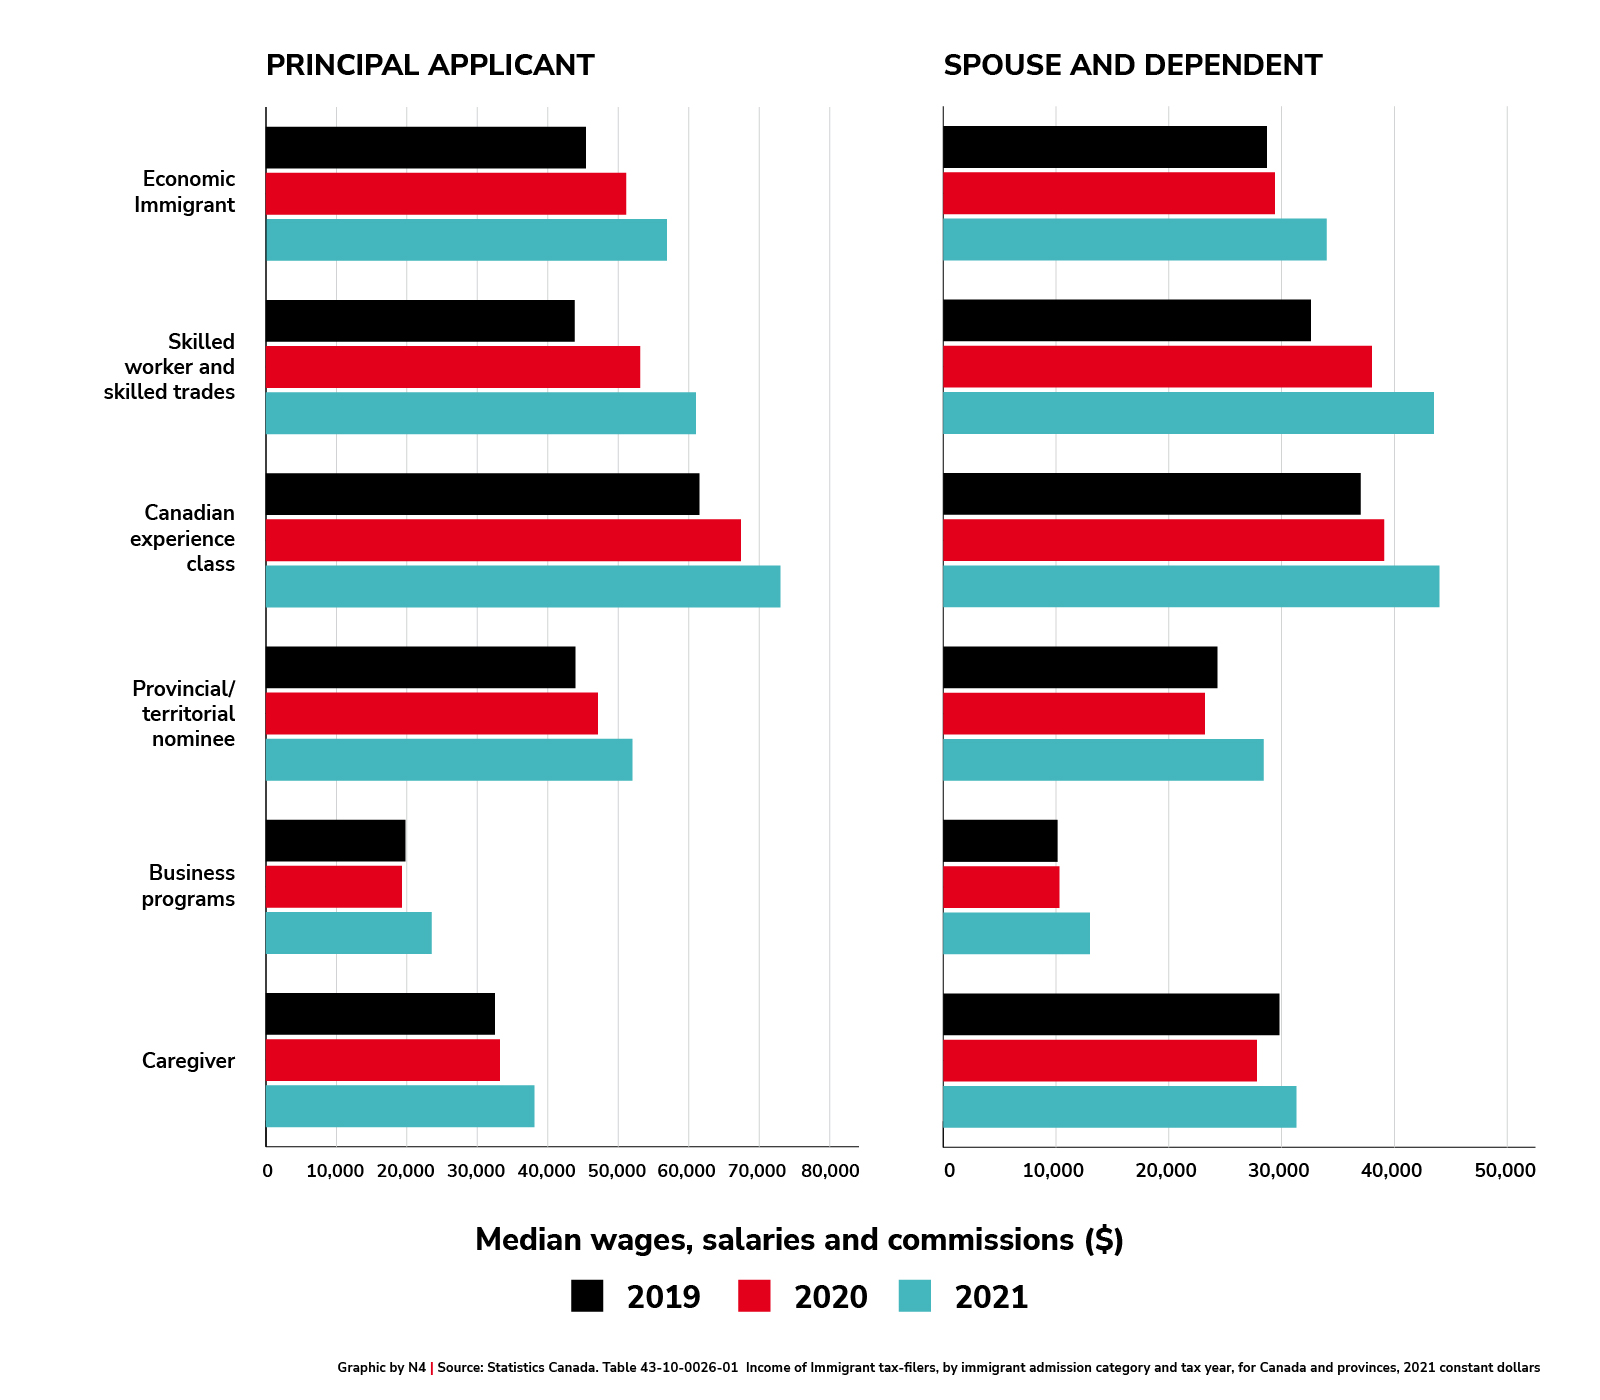
Source :Statistics Canada. Table 43-10-0026-01 Income of Immigrant tax-filers, by immigrant admission category and tax year, for Canada and provinces, 2021 constant dollars, https://www150.statcan.gc.ca/t1/tbl1/en/tv.action?pid=4310002601&pickMembers%5B0%5D=1.1&pickMembers%5B1%5D=2.1&pickMembers%5B2%5D=3.1&pickMembers%5B3%5D=4.1&pickMembers%5B4%5D=5.11&pickMembers%5B5%5D=7.5&cubeTimeFrame.startYear=2019&cubeTimeFrame.endYear=2021&referencePeriods=20190101%2C20210101.
Median self-employment income of immigrants admitted in 2018, by admission category
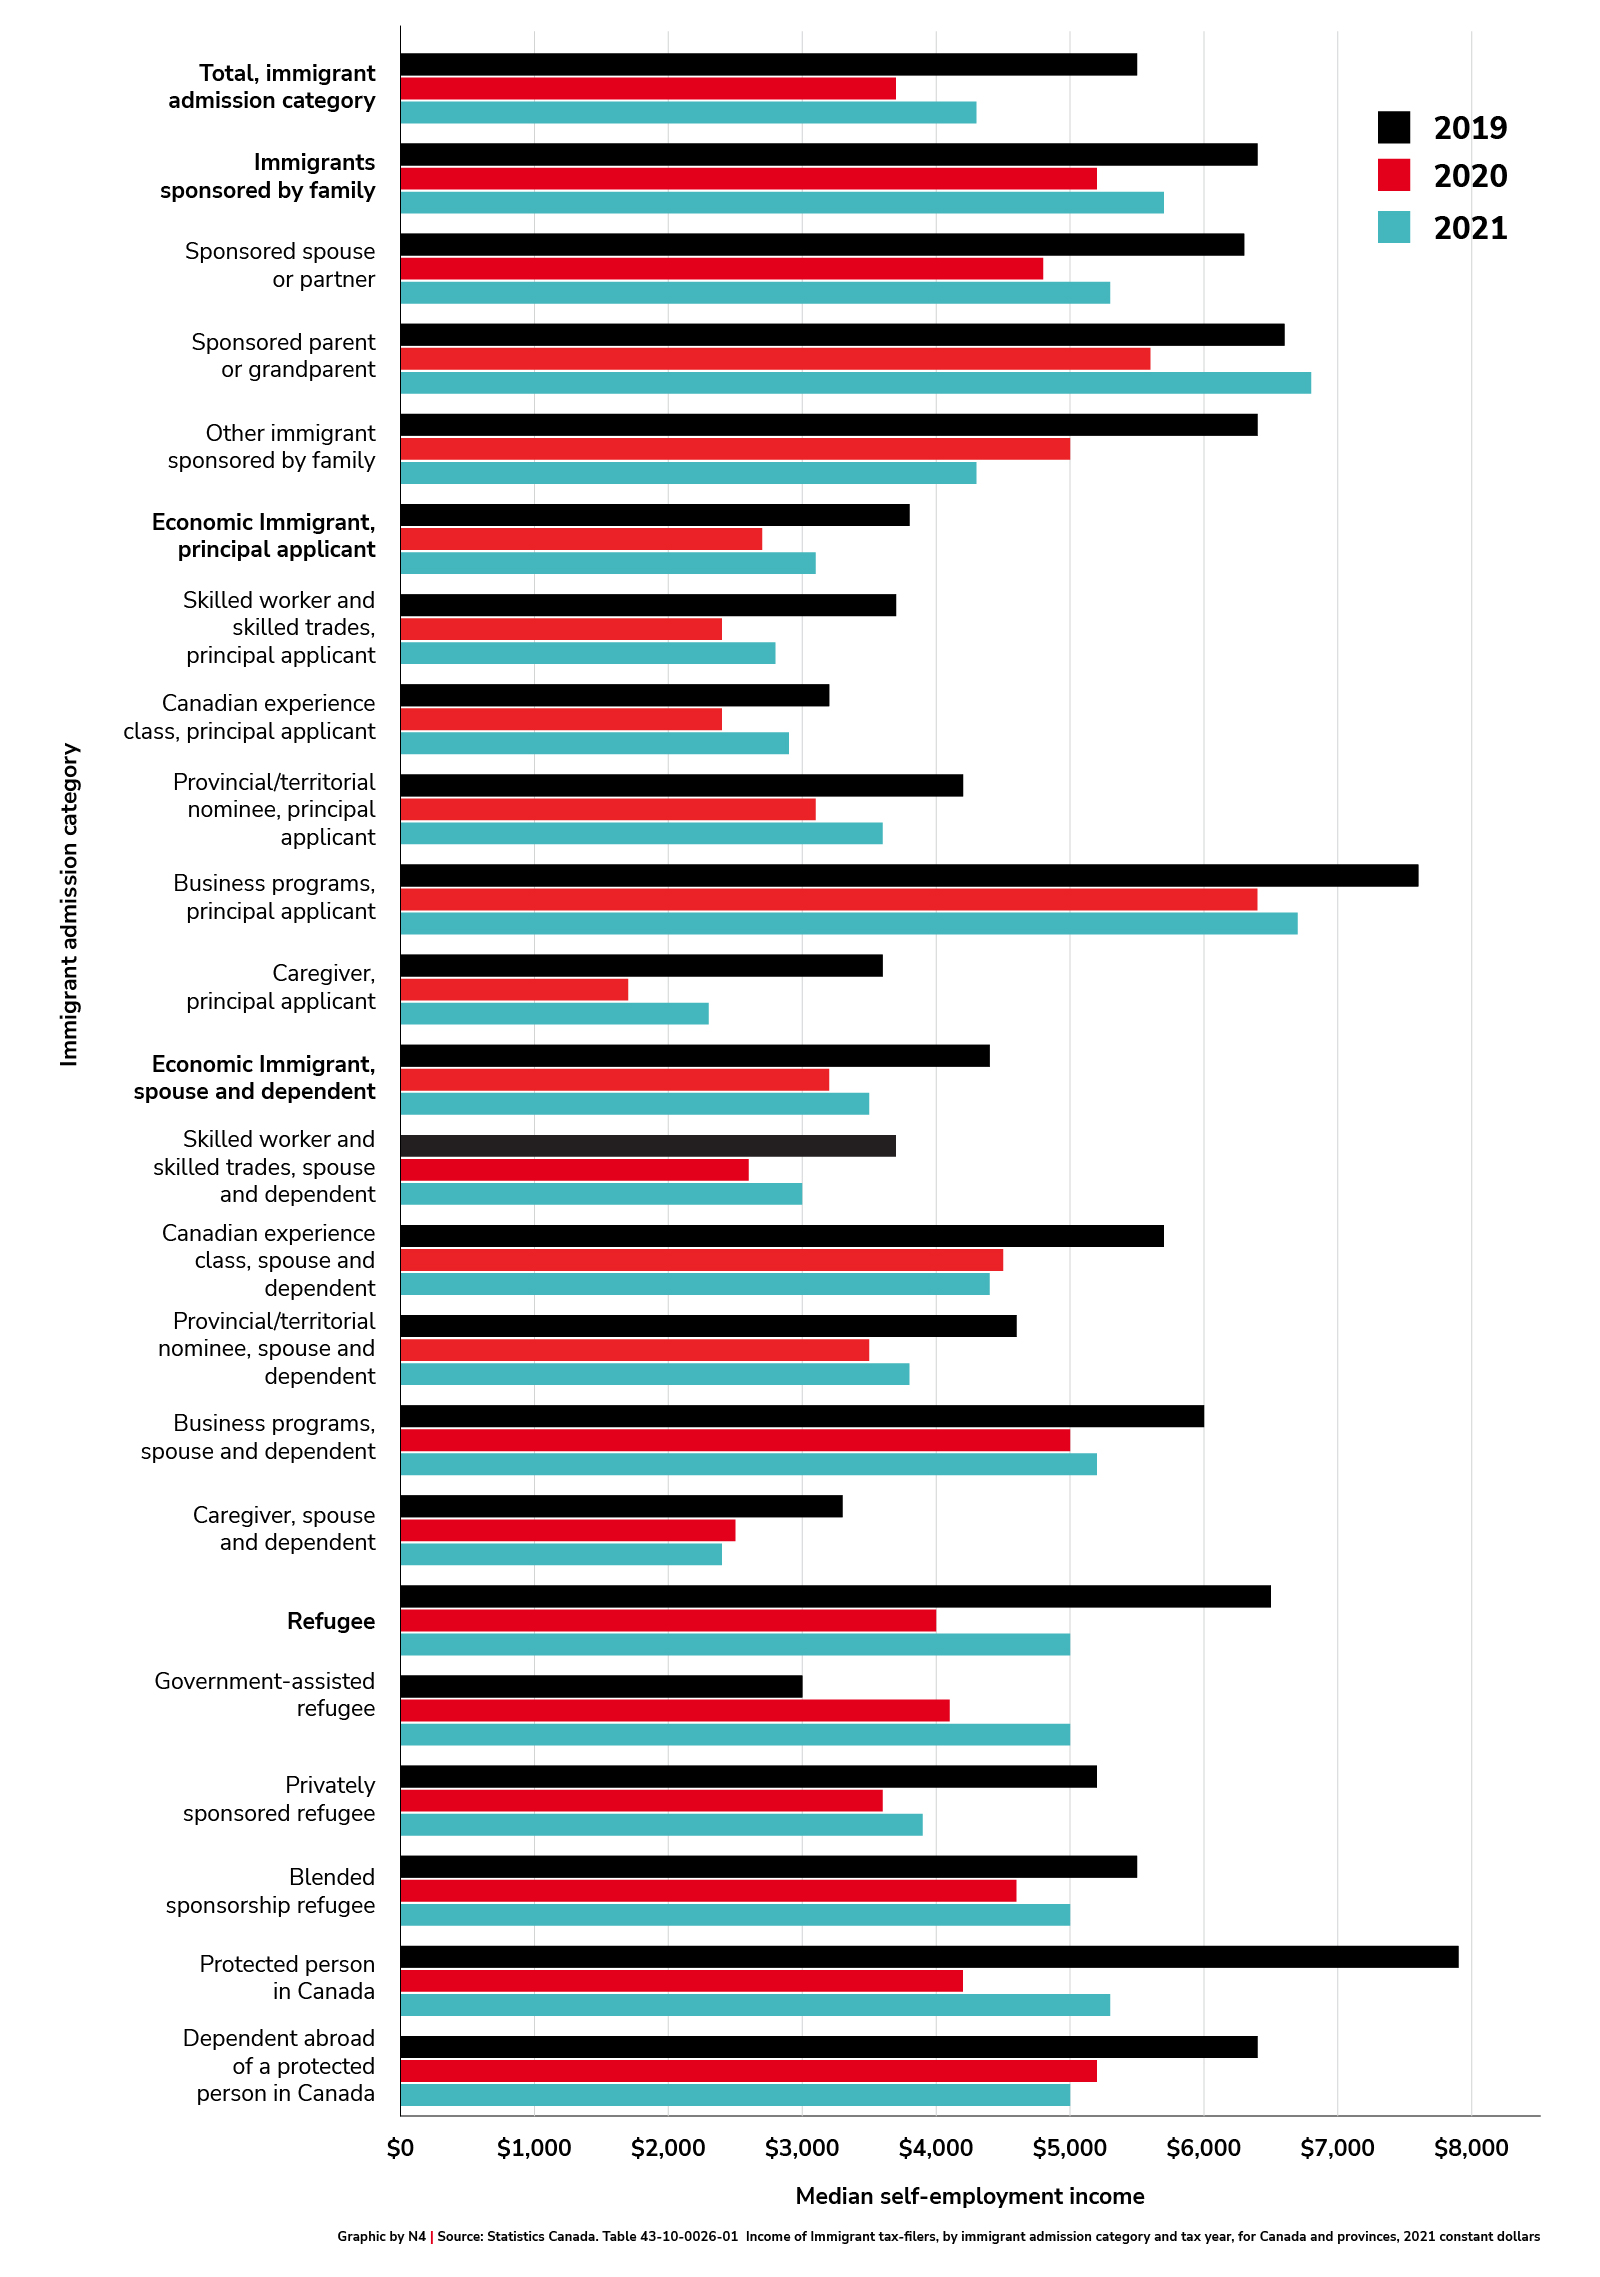
Source: Statistics Canada. Table 43-10-0026-01 Income of Immigrant tax-filers, by immigrant admission category and tax year, for Canada and provinces, 2021 constant dollars, https://www150.statcan.gc.ca/t1/tbl1/en/tv.action?pid=4310002601&pickMembers%5B0%5D=1.1&pickMembers%5B1%5D=2.1&pickMembers%5B2%5D=3.1&pickMembers%5B3%5D=4.1&pickMembers%5B4%5D=5.11&pickMembers%5B5%5D=7.5&cubeTimeFrame.startYear=2019&cubeTimeFrame.endYear=2021&referencePeriods=20190101%2C20210101.
Incidence of social assistance for immigrants admitted in 2018, by admission category
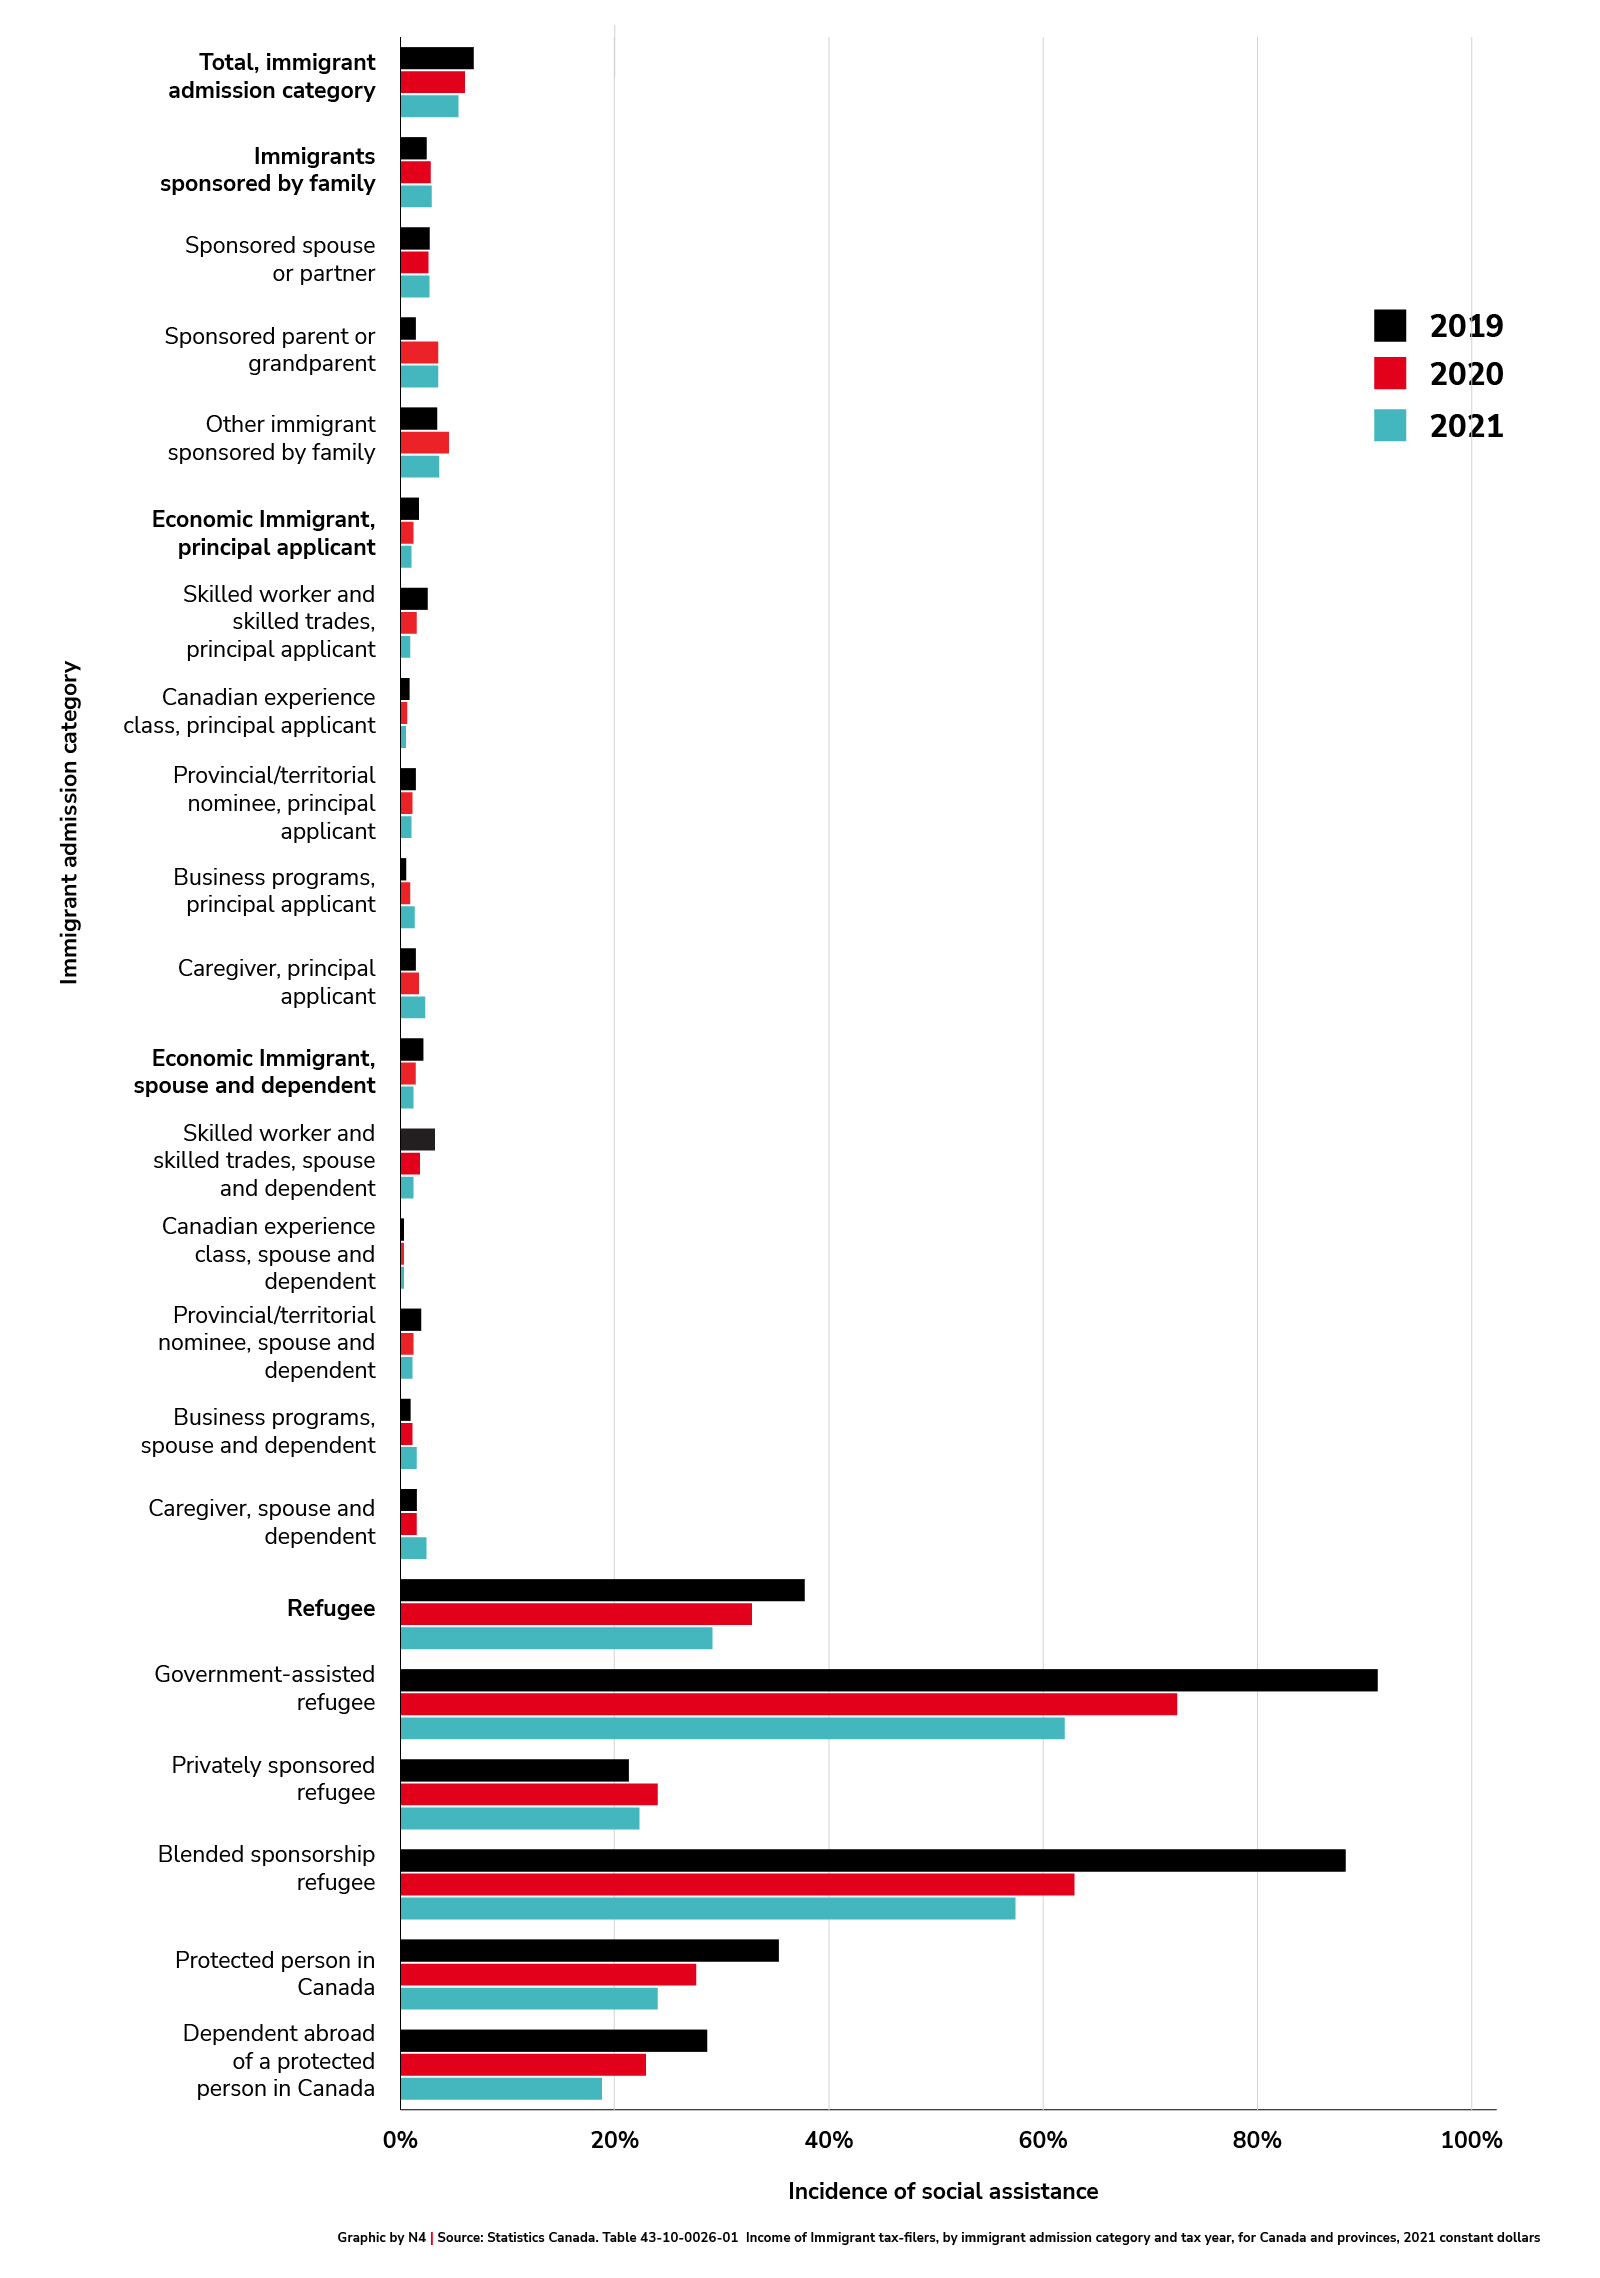
Source: Statistics Canada. Income of Immigrant tax-filers, by immigrant admission category and tax year, for Canada and provinces, 2021 constant dollars. https://www150.statcan.gc.ca/t1/tbl1/en/tv.action?pid=4310002601&pickMembers%5B0%5D=1.1&pickMembers%5B1%5D=2.1&pickMembers%5B2%5D=3.1&pickMembers%5B3%5D=4.1&pickMembers%5B4%5D=5.11&pickMembers%5B5%5D=7.11&cubeTimeFrame.startYear=2019&cubeTimeFrame.endYear=2021&referencePeriods=20190101%2C20210101.
Average and median employment income, by visible minority status and first official language (2021 census data)
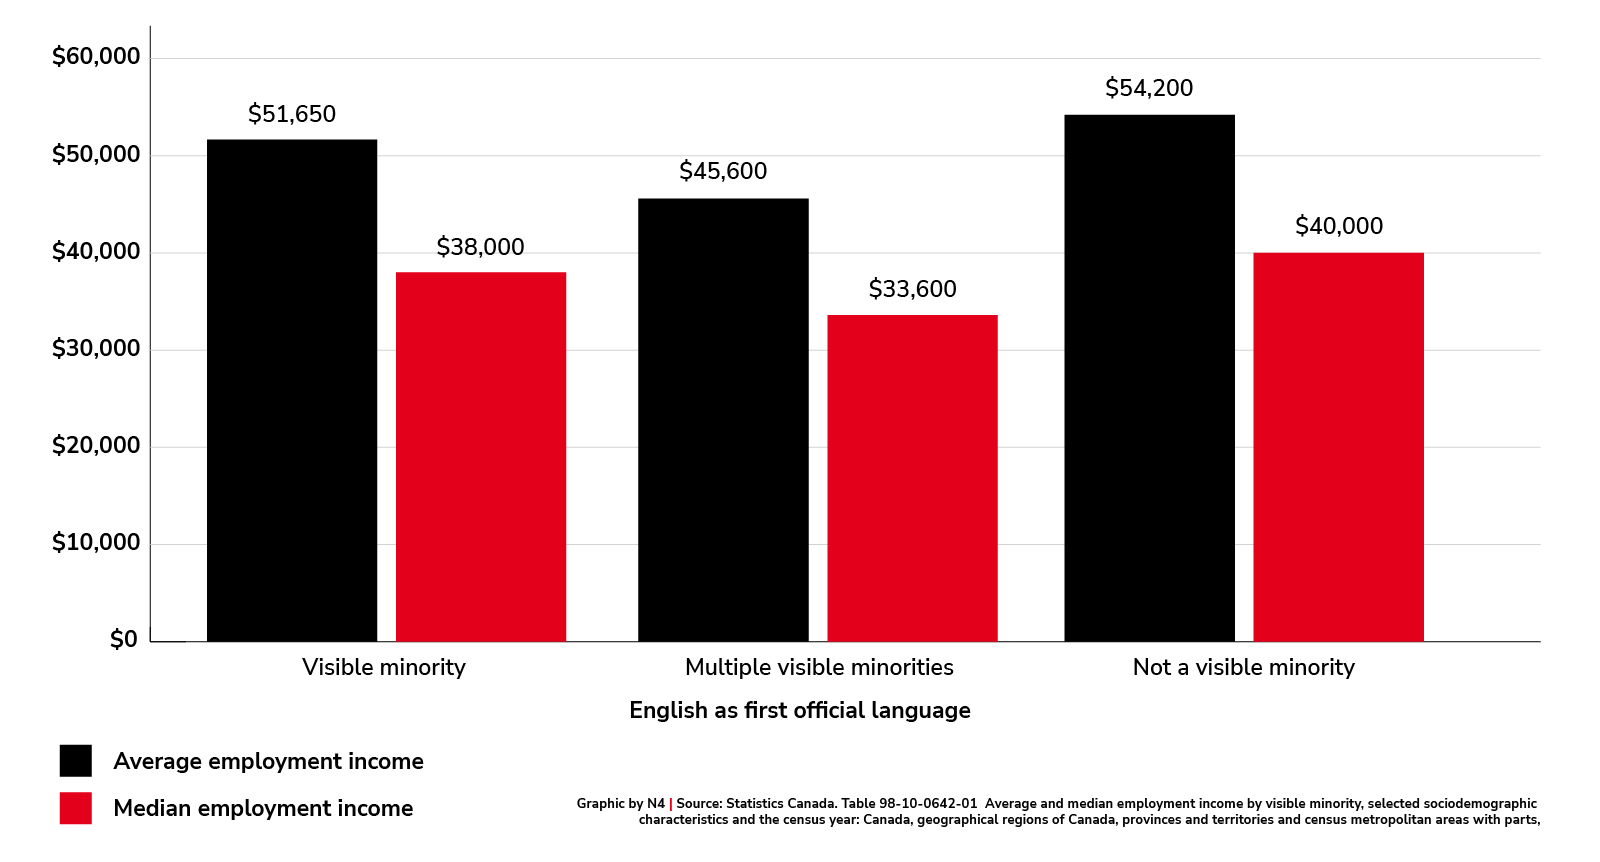
Source: Statistics Canada. Table 98-10-0642-01 Average and median employment income by visible minority, selected sociodemographic characteristics and the census year: Canada, geographical regions of Canada, provinces and territories and census metropolitan areas with parts, https://www150.statcan.gc.ca/t1/tbl1/en/tv.action?pid=9810064201&pickMembers%5B0%5D=1.1&pickMembers%5B1%5D=3.1&pickMembers%5B2%5D=4.17&pickMembers%5B3%5D=5.1&pickMembers%5B4%5D=7.1&pickMembers%5B5%5D=8.1
Source: Statistics Canada. Table 98-10-0642-01 Average and median employment income by visible minority, selected sociodemographic characteristics and the census year: Canada, geographical regions of Canada, provinces and territories and census metropolitan areas with parts, https://www150.statcan.gc.ca/t1/tbl1/en/tv.action?pid=9810064201&pickMembers%5B0%5D=1.1&pickMembers%5B1%5D=3.1&pickMembers%5B2%5D=4.17&pickMembers%5B3%5D=5.1&pickMembers%5B4%5D=7.1&pickMembers%5B5%5D=8.1
International immigration by quarter, 2018 to 2023
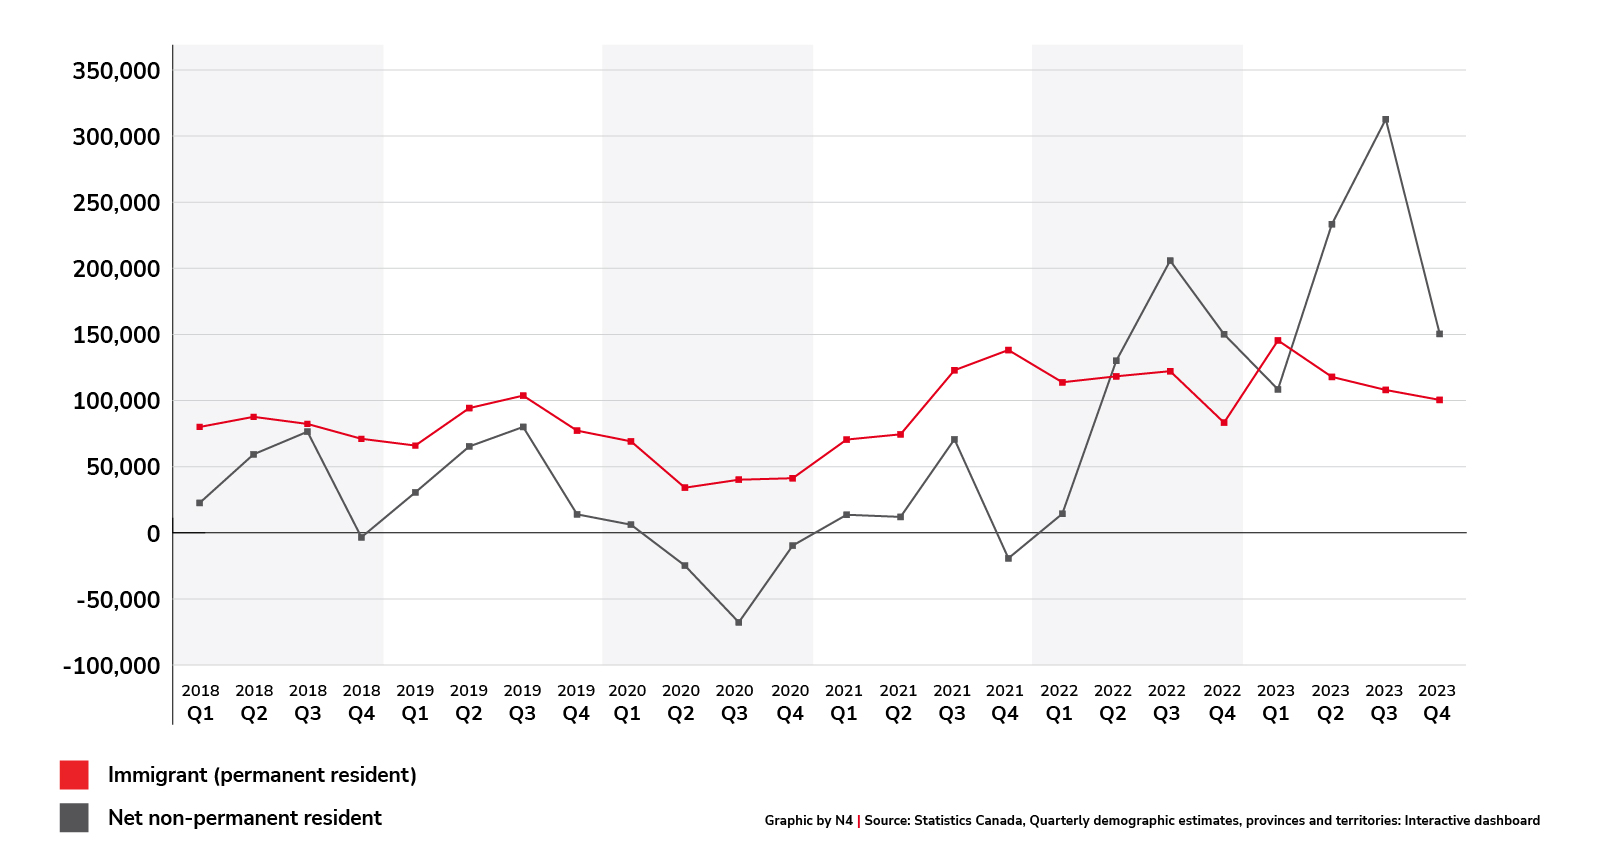
Source: Statistics Canada, Quarterly demographic estimates, provinces and territories: Interactive dashboard, https://www150.statcan.gc.ca/n1/pub/71-607-x/71-607-x2019036-eng.htm
Suggested Citation: National Newcomer Navigation Network, "Comparative economic data about various immigrant groups, by year of admission and admission type", September 2024, https://www.newcomernavigation.ca/en/data/comparative-economic-data-about-various-immigrant-groups.aspx